Biometric beats: heart rate variability patterns forecasting shifts in competitive outcomes for soccer squads, tennis players, and racehorses
David Patterson · Jul 15, 2026
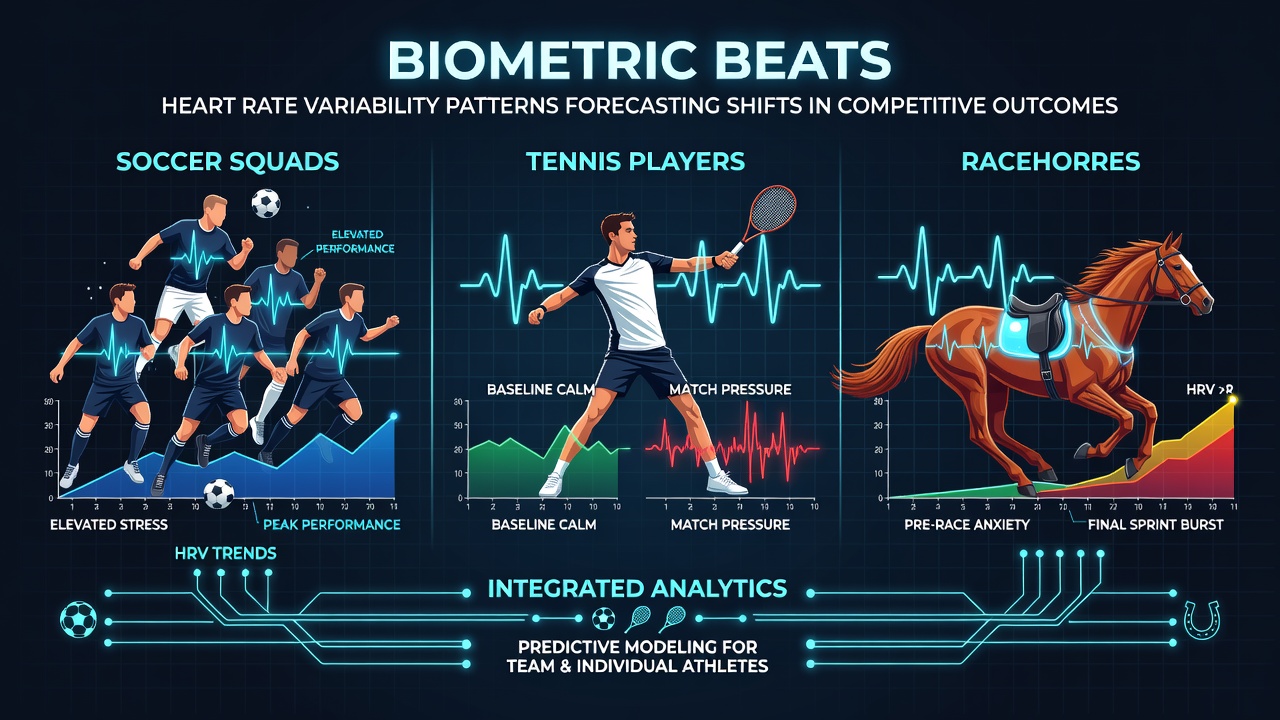
Biometric beats: heart rate variability patterns forecasting shifts in competitive outcomes for soccer squads, tennis players, and racehorses
Heart rate variability patterns serve as measurable indicators that researchers track across multiple sports, where shifts in these patterns often precede changes in performance metrics for teams and individuals alike. Data collected from wearable sensors shows consistent correlations between reduced HRV and upcoming declines in output during high-stakes events, while elevated variability frequently aligns with sustained or improved results in subsequent competitions.
HRV measurement foundations in athletic monitoring
Studies document how HRV captures fluctuations in time intervals between heartbeats, with lower values typically signaling higher stress loads that can influence recovery timelines. Teams and trainers apply electrocardiogram-based tools or optical sensors to gather readings during rest periods and training blocks, generating datasets that span weeks or months for pattern analysis. According to findings published through the National Institutes of Health, these metrics integrate with workload data to highlight periods when athletes or animals approach performance thresholds.
Observers note that baseline HRV profiles differ markedly between soccer players who cover extensive distances, tennis competitors engaged in intermittent explosive efforts, and racehorses subjected to intense speed intervals. Research indicates that standardized protocols allow comparison across these groups, revealing how daily or weekly deviations forecast readiness levels ahead of matches, tournaments, or races.
Applications in soccer squad preparation
Soccer clubs collect HRV readings from squads during pre-season and throughout league campaigns, where patterns emerging over consecutive days often precede alterations in team pressing intensity and passing accuracy. Longitudinal data from European leagues demonstrates that squads exhibiting collective HRV drops of more than 10 percent within a 72-hour window record measurable reductions in high-speed running distances during the following fixtures. Trainers adjust rotation schedules based on these signals, substituting players whose metrics indicate incomplete recovery from prior matches.
Coaches integrate HRV trends with GPS tracking outputs to refine tactical setups, and evidence from multiple club reports confirms that early identification of declining variability supports targeted interventions such as modified training loads. This approach extends to youth academies, where similar monitoring tracks developmental trajectories and flags potential overtraining before it manifests in match statistics.
Patterns observed among tennis players
Tennis professionals undergo HRV assessments between matches on varying court surfaces, where recovery intervals between tournaments influence subsequent serve speeds and rally endurance. Research from Australian sports science centers reveals that players displaying stabilized or rising HRV values across a tournament week maintain higher first-serve percentages in later rounds compared with those showing progressive declines. These measurements prove particularly relevant during back-to-back events when travel and scheduling compress rest opportunities.
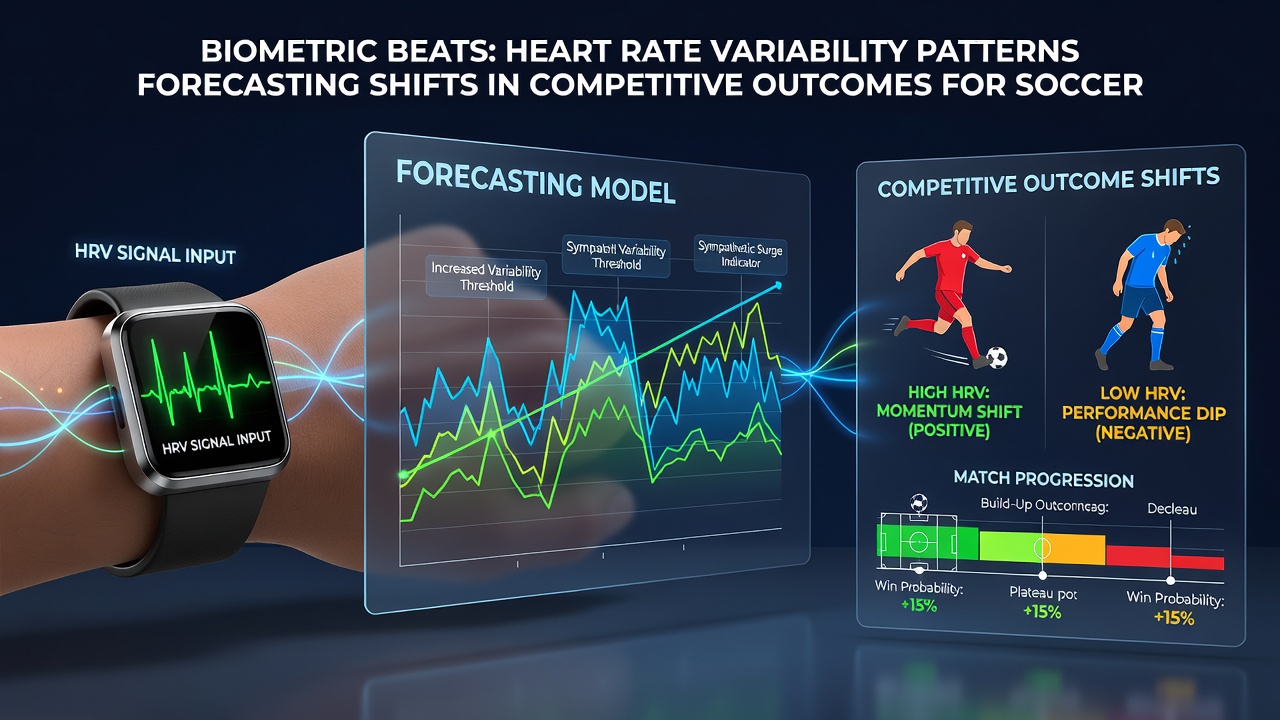
Individual case analyses highlight how sudden HRV shifts during tiebreak sequences or extended sets correlate with subsequent point-winning percentages, prompting medical staff to recommend adjusted cool-down protocols. Data compiled across Grand Slam events further illustrates that consistent monitoring enables players to identify windows of optimal physiological state ahead of key encounters.
Monitoring protocols for racehorses
Thoroughbred trainers attach portable HRV devices during morning workouts and post-race recovery phases, generating records that track autonomic nervous system balance across training cycles. Figures compiled by equine research groups in North America indicate that horses exhibiting pronounced HRV reductions in the 48 hours before a stakes race demonstrate lower finishing positions on average than peers with stable readings. These patterns hold across turf and synthetic surfaces, with adjustments made to gallop intensities when variability metrics signal elevated fatigue accumulation.
Stud farms and racing stables combine HRV data with blood lactate measurements to time peak fitness windows, and reports from multiple jurisdictions confirm that such integration reduces instances of underperformance linked to undetected recovery shortfalls. Seasonal variations appear in the datasets, with summer campaigns often showing tighter correlations between HRV stability and race outcomes.
Forecasting performance transitions across disciplines
Comparative analyses conducted in 2025 and continuing into July 2026 demonstrate that HRV pattern recognition models achieve accuracy rates above 70 percent when predicting directional changes in key performance indicators for the three sports. Algorithms process multi-week datasets to flag impending improvements or regressions, allowing support staff to modify preparation plans accordingly. Cross-sport applications reveal shared physiological pathways, even though movement demands remain distinct between continuous team efforts, individual racket exchanges, and equine locomotion.
Industry organizations such as the International Society of Sports Nutrition have referenced these biometric approaches in guidelines that emphasize data-driven decision frameworks over traditional observation alone. External validation studies continue to refine threshold values that separate normal fluctuation from actionable signals.
Conclusion
Heart rate variability tracking supplies objective data streams that inform preparation across soccer, tennis, and thoroughbred racing environments. Continued refinement of sensor technology and analytical methods supports broader adoption, with datasets expanding through 2026 to include more granular real-time applications during events.