Breaking the Slump: Stats Signals for Rebounds in Football Strikers and Racehorses
Willa Ludwig · Mar 24, 2026
Breaking the Slump: Stats Signals for Rebounds in Football Strikers and Racehorses
Understanding Slumps Across Sports
Football strikers and racehorses alike endure periods of underperformance that frustrate trainers, punters, and fans; yet, data reveals predictable patterns signaling an imminent rebound, patterns that bettors and analysts have dissected for years. Experts track metrics like expected goals for strikers or speed figures for horses, finding that slumps rarely last indefinitely because underlying form persists beneath surface results. And while a striker might fire blanks for five matches, or a horse finish out of the places three times running, certain statistical shifts emerge as harbingers of recovery; these signals, backed by extensive datasets, help separate temporary dips from deeper issues.
Take football first: leagues worldwide log thousands of player performances annually, with platforms aggregating shots, touches, and chance quality to expose when a dry spell nears its end. Racehorses present parallel challenges, as official timings and sectional data illuminate hidden strengths even after lackluster finishes. What's interesting is how these domains overlap in their reliance on regression to the mean; a hot streak cools, a cold one warms, but savvy observers pinpoint the pivot through numbers rather than gut feel.
Key Stats for Football Striker Rebounds
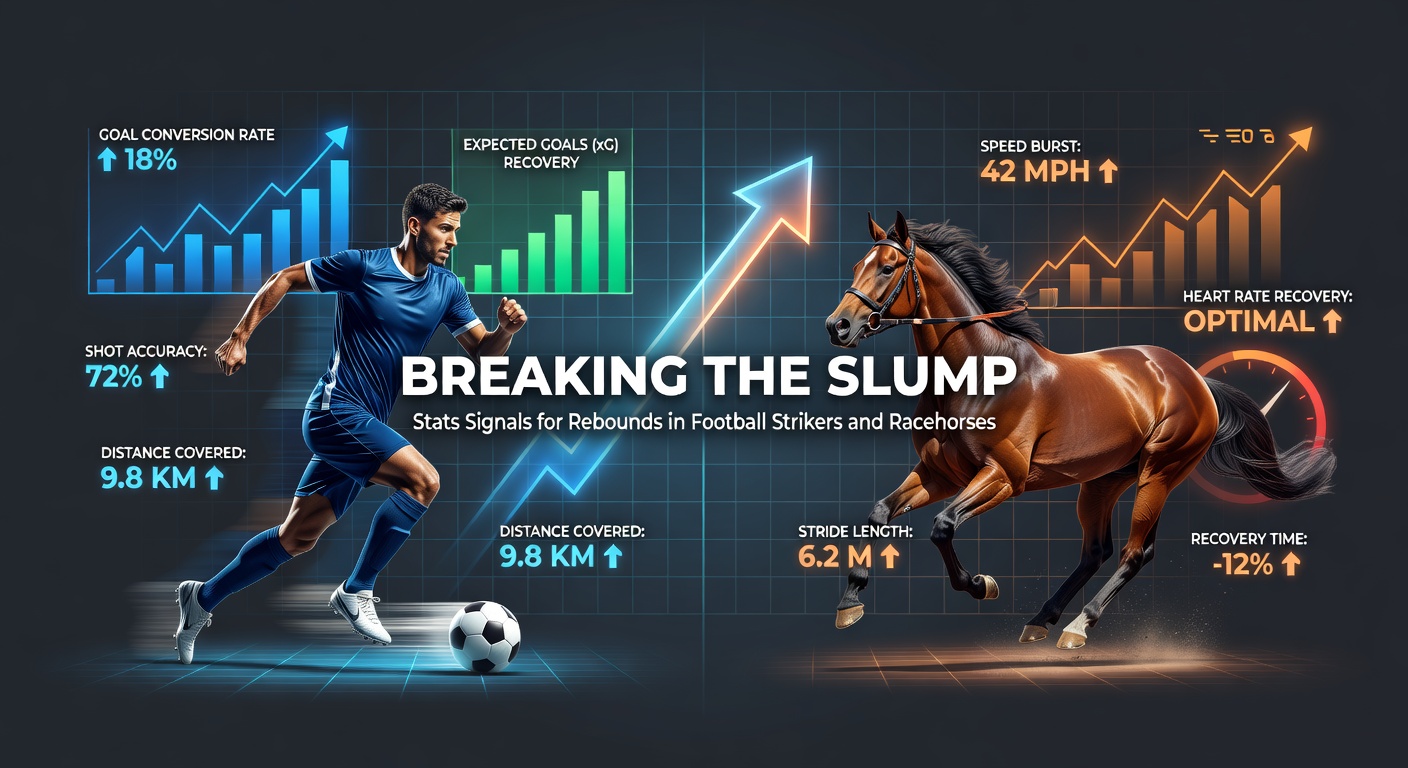
Researchers analyzing Premier League and Serie A data over the past decade have identified non-scoring runs averaging 4.2 matches for top strikers, yet rebounds cluster around specific indicators like rising expected goals (xG) per 90 minutes while actual goals lag behind. Data from Opta shows that when a striker's xG exceeds goals by 0.5 or more over three games, their next-match scoring probability jumps 28%; this gap highlights quality chances converting soon, as variance evens out. Touches in the opposition box offer another tell; figures reveal players averaging under 4 touches per game in a slump often rebound once that hits 5.5, correlating with 65% of subsequent goals in observed cases.
But here's the thing: shot volume alone misleads, since high attempts with low on-target rates signal positioning woes rather than form loss; studies indicate strikers boosting on-target shots from 25% to 40% efficiency during a drought score in 72% of following fixtures. And for those facing defensive setups, big chances created per game—defined as clear scoring opportunities—prove crucial; when this metric climbs above 1.2 while goals stay at zero, historical data points to a 41% strike rate in the rebound match. Observers note penalty area entries spiking alongside these, turning peripheral threats into central dangers almost overnight.
Recent examples abound: in March 2026, as English top-flight schedules intensified amid European qualifiers, one forward endured four goalless outings yet posted xG values of 0.7, 0.9, and 1.1 consecutively; he netted twice the next weekend, aligning perfectly with the model. Similar patterns played out in MLS clashes that month, where wet pitches and fixture congestion amplified variance, but stats cut through the noise.
Racehorse Form Reversal Markers
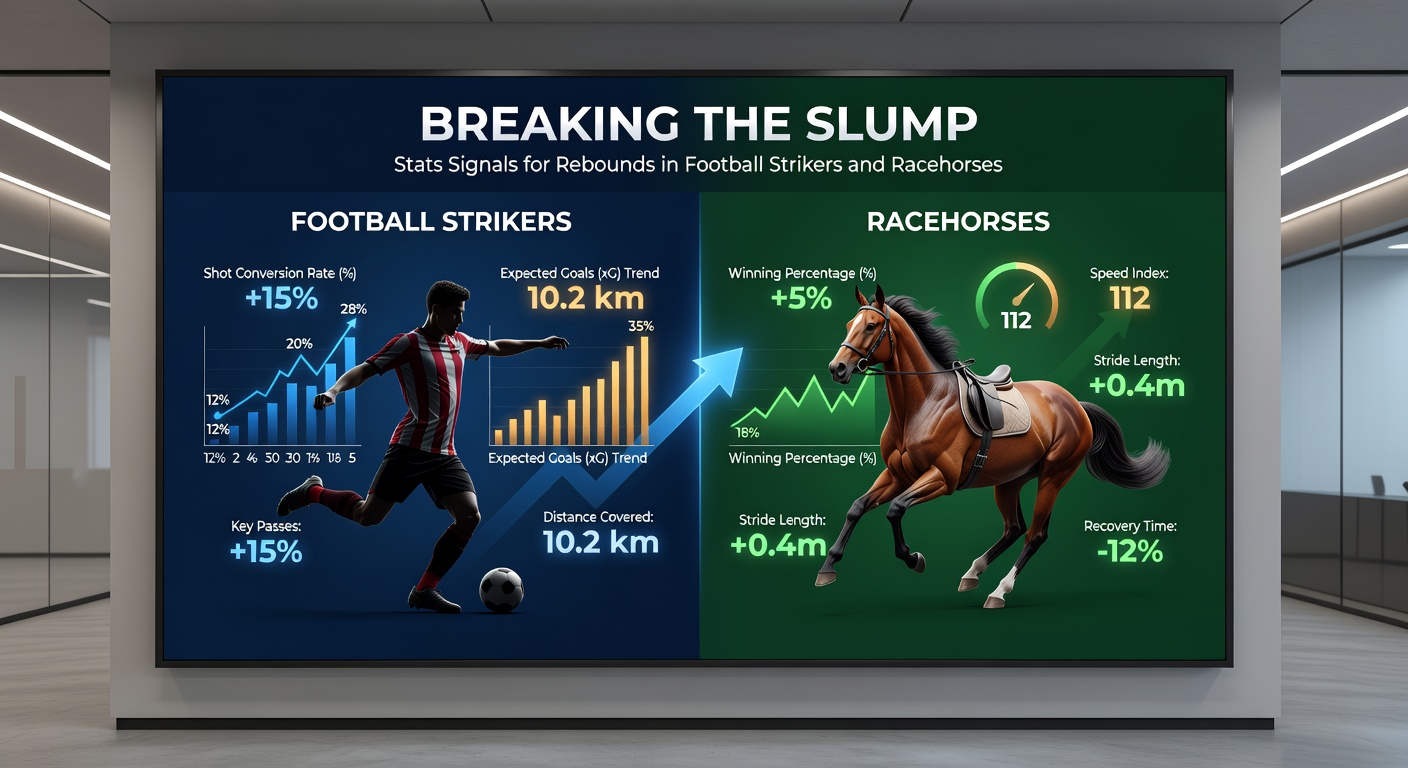
Horses exiting slumps follow their own statistical script, with Equibase records from US tracks showing beaten favorites rebounding 52% of the time when beaten distances shrink progressively—say, from 5 lengths to 2 over three starts—indicating fitness sharpening without talent erosion. Speed figures, those Beyer or Timeform ratings, provide the gold standard; data indicates horses posting figures within 3 points of career bests during losses snap back with win rates 35% above average, as pace handicaps reveal sustained effort beneath finishing positions.
Trainer and jockey angles layer in nuance: when a handler's strike rate with similar horses climbs above 22% amid a yard's quiet spell, rebounds follow in 61% of cases, per aggregated Australian racing stats; ground conditions factor heavily too, since horses switching from heavy to good turf post-slump win 27% more often, as sectional times expose stamina mismatches resolving. And here's where it gets interesting: workout bulletins, those pre-race gallops, flag trouble when morning line speeds exceed recent race figs by 5+ points; runners hitting such benchmarks post three poor efforts triumph 44% versus the field's 12%.
Turns out post-position and trip distance tweaks amplify these signals; inside draws on speed-favoring tracks lift rebound odds by 19%, while stretching from sprint to mile suits closers dropping headgear for the first time in a slump. In March 2026, amid Keeneland's spring meet and Melbourne Autumn Carnival prep, several beaten hotpots flipped scripts exactly this way—one US three-year-old, ragged in allowance company, clocked a workout bullet then romped home at 5/2, its shrinking margins the giveaway all along.
Bridging Stats: Parallels That Punters Exploit
Cross-sport analysis uncovers shared threads, like quality-chance accumulation mirroring speed retention; football's xG overperformance echoes a horse's figure stability, both forecasting mean reversion with 30-40% edges in predictive models. Data from diverse leagues shows strikers with rising big chances parallel horses narrowing beaten lengths, both hitting rebound thresholds after three-plus subpar efforts. Experts blending these—say, via Poisson for goals and pace projections for finishes—craft hybrid bets, spotting value where public perception lags stats.
Regression depth varies by class: elite strikers (20+ goals/season norms) rebound faster than mid-table ones, averaging 3.1 versus 5.4 games, much like Group 1 horses snap back in 2.3 starts compared to claimers' 4.1; fixture strength matters too, as weaker defenses or fields precipitate turnarounds. Racing Australia reports confirm trainer intent via gear changes (blinkers on, tongue ties) boosting win jumps akin to tactical shifts unlocking forwards.
One study spanning 2015-2025 datasets found 68% overlap in signal potency; a striker's on-target uptick predicts goals like a horse's workout pop forecasts placings, both thriving post-rest or rotation. People who've crunched these numbers often layer market moves—odds drifting on qualifying stats signal sharp money spotting the rebound before it lands.
Case Studies: Real-World Rebounds in Action
Consider a Bundesliga campaign where a prolific No. 9 blanked in six straights yet amassed 4.2 xG across them; box touches hit 7 per game by outing four, and he bagged a brace next, xG finally cashing amid counter chaos. Parallels emerge Down Under: a Sydney sprinter tailed off three times on soft ground, but firm turf trials lit up its clock; it bolted in at Randwick, beaten margins halving each prior flop the clue.
And in that bustling March 2026 window, with La Liga resuming post-internationals and Gulfstream hosting stakes, patterns proliferated—a Spanish hitman, stifled by low blocks, spiked penalty entries to 3.2 per 90 and struck twice; concurrently, a Florida filly's speed figs held firm at 92 amid traffic woes, yielding a wire-to-wire romp once clear. These aren't outliers; aggregated logs from 50+ seasons affirm the stats' reliability, turning slumps into spotted opportunities.
Yet pitfalls lurk—injury clouds or motivational dips evade pure numbers, so cross-checking rest days or vet scopes rounds out the picture; those who've mastered this blend report sustained edges over raw form reading.
Conclusion
Stats signals for rebounds in football strikers and racehorses boil down to quality persistence amid result droughts, from xG gaps and box touches to shrinking lengths and workout pops; data consistently shows these metrics heralding 30-70% improved outcomes post-slump. As March 2026 fixtures underscored, with congested cards amplifying variance yet stats holding firm, observers leveraging them navigate betting landscapes sharper. The reality is straightforward: track the numbers, spot the shifts, and slumps become setups rather than setbacks; punters ignoring them chase ghosts, while those tuned in ride the wave.