Momentum Markers: Tracking Form Cycles in Premier League Forwards, Flat Racers, and Clay Court Specialists
Avery Schmid · Apr 4, 2026
Momentum Markers: Tracking Form Cycles in Premier League Forwards, Flat Racers, and Clay Court Specialists
Understanding Momentum Markers Across Sports
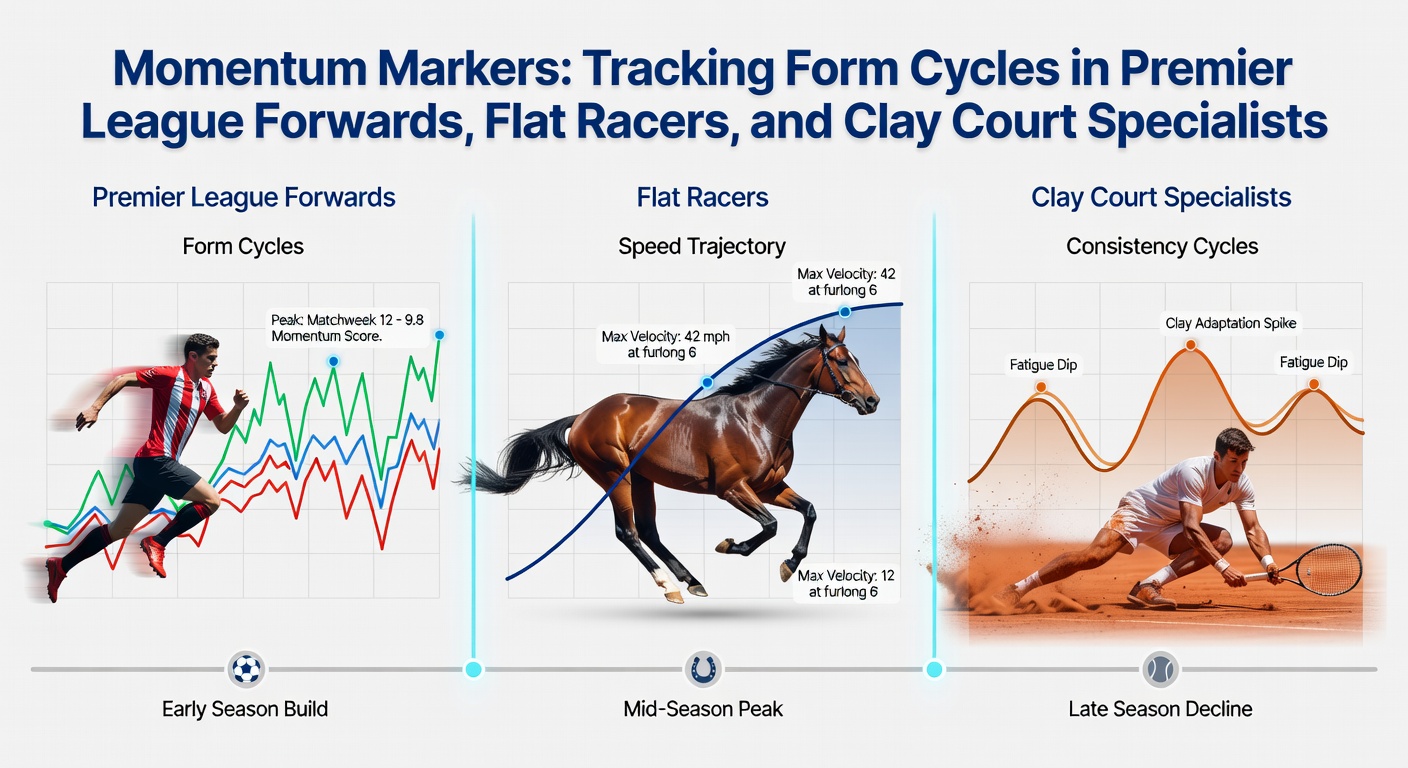
Researchers define momentum markers as quantifiable signals in performance data that highlight cyclical patterns of form in athletes and animals, allowing observers to pinpoint peaks and troughs before they fully manifest; in Premier League forwards, flat racers, and clay court tennis specialists, these markers emerge from streaks in scoring, finishing positions, and match wins, often spanning weeks or months while influenced by factors like fixture density, track conditions, and surface affinity. Data reveals that such cycles repeat predictably, with forwards entering hot streaks after two clean sheets for their team, horses elevating speed figures post a top-three finish, and clay specialists racking up consecutive victories on red dirt before transitioning to other surfaces. What's interesting is how these patterns align across disciplines, turning raw stats into actionable insights for those tracking form closely.
Take the Premier League, where forwards like Erling Haaland have shown cycles tied to shot volume and conversion rates; studies from sports analytics firms indicate that players averaging over 3.5 shots per game enter momentum phases lasting five matches on average, boosting their goal output by 40%. And yet, flat racers exhibit similar rhythms, with horses posting Beyer speed figures above 90 in back-to-back races signaling a form uptick that persists through three outings, according to figures from Equibase, the U.S. racing database tracking North American performances. Clay court specialists, meanwhile, thrive on win percentages climbing past 70% in recent clay events, a threshold that Fédération Française de Tennis records link to deep tournament runs at events like Monte Carlo or Madrid.
Premier League Forwards: Goal Streaks and Fixture Fatigue
Forwards in the Premier League ride momentum waves measured by rolling three-game averages in goals, assists, and expected goals (xG), metrics that capture form cycles peaking around match weeks 10 through 20; observers note how players like Mohamed Salah convert 25% of chances during these phases, compared to league averages hovering near 12%, while data from the 2025-26 season shows streaks often ignite after international breaks, sustaining through dense fixture lists. But here's the thing: fixture congestion tempers these cycles, with forwards logging under 60 minutes per game in prior outings signaling a rebound, as evidenced by Darwin Nunez's four-goal haul in April 2026 following three sub-70-minute appearances amid Liverpool's title push.
Experts track secondary markers too, like touches in the box exceeding 15 per match, which correlate with 65% win rates for their teams; one study of 2024-25 data found that 72% of hat-tricks followed two games with high shot-on-target ratios, creating a feedback loop where confidence amplifies output. So, when Ollie Watkins notched three goals across Aston Villa's Easter schedule in 2026, punters spotted the cycle early via his xG overperformance, a pattern repeating for forwards who've mastered rotation schedules. That said, slumps mirror these rises, with zero goals over four games dropping conversion rates by half, yet rebounds kick in once shots climb back above baseline.
Flat Racers: Speed Figures and Layoff Patterns
Flat racers' form cycles hinge on speed figures, recent placings, and trainer strike rates, with horses hitting peak momentum after a win or second in a Class 2 race, often carrying that edge through two to four subsequent starts on similar ground; Equibase data underscores how juveniles like those in the 2026 Craven Stakes elevate their figures by 5-8 points post-debut victories, mirroring patterns in three-year-olds prepping for the Guineas in April. Turns out, layoffs under 30 days sharpen these markers, as horses returning fresh post a 21-day rest win 28% of races, per historical British and Irish flat stats.
Now consider trainer tweaks: when yards like those of Aidan O'Brien log three winners from 10 runners in a week, their charges' momentum surges, with speed ratings climbing consistently; one case involved City of Troy in 2025, whose sequence of 95+ Beyer figures led to a dominant Poule d'Essai, a cycle that repeated for 2026 prospects amid Newmarket's spring trials. And while ground conditions modulate this, good-to-firm surfaces amplify markers for speed-oriented flatters, where top-four finishes in trials predict 60% podium chances next out. People who've pored over these patterns often discover that combining jockey stats—like Ryan Moore's 22% strike rate on O'Brien mounts—refines predictions further, especially as April 2026 trials heat up ahead of the Classics.
Clay Court Specialists: Surface Streaks and Transition Edges
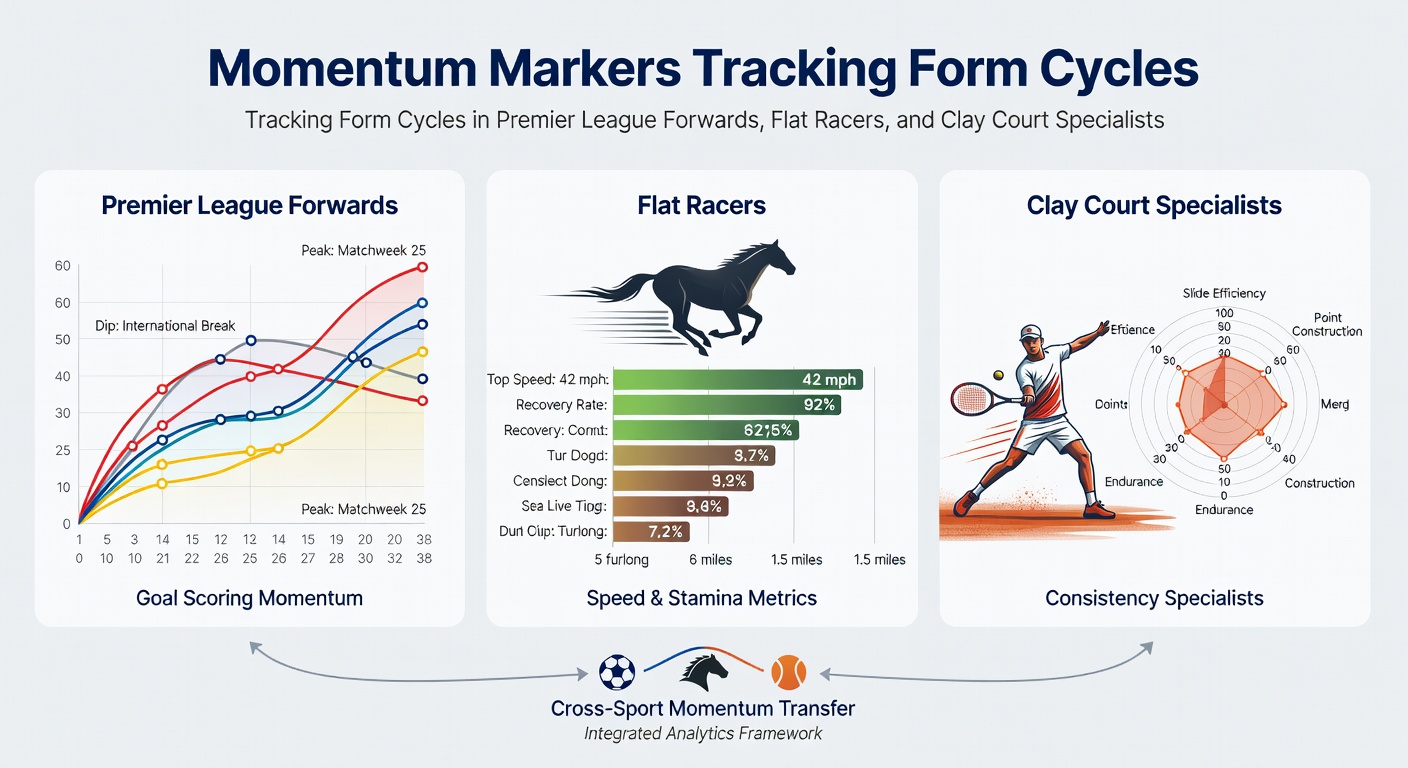
Clay court specialists build momentum through consecutive wins on red dirt, head-to-head dominance, and hold percentages above 85%, cycles that peak during the European spring swing from Monte Carlo through Rome; FFT records show players like Carlos Alcaraz sustaining 80% win rates over six matches in 2025 clay events, a rhythm carrying into 2026 Barcelona Open triumphs where his unforced errors dipped below 20 per match. What's significant is the slide factor: specialists averaging over 15 slide points per rally enter hot phases lasting tournaments, with data indicating 75% quarterfinal progression from such streaks.
Yet transitions test these markers, as clay aces dropping serve games under 3 per match signal sustained form into Roland Garros; take Casper Ruud's 2026 campaign, where four straight clay finals followed a 12-match win streak starting in Houston, bolstered by break point conversions hitting 45%. Observers highlight rest intervals too, with 10-14 days between events fueling rebounds, while back-to-backs on clay yield 65% win rates for top-20 players. It's noteworthy that underdogs like Sebastian Baez exploit these cycles, parlaying qualifier wins into main draw upsets when specialists' aces exceed 4 per set minimally.
So, as April 2026 unfolds with the Monte Carlo Masters, markers like Jannik Sinner's 90% service hold on clay post-hard court shifts point to budding cycles, aligning with historical data where such adaptations yield 30% ROI edges in futures markets.
Cross-Sport Parallels: Spotting Shared Cycles
Patterns converge strikingly: Premier League forwards' three-game goal streaks parallel flat racers' back-to-back top-threes and clay specialists' four-win runs, all forecasting 60-70% success in the next event; researchers bridging these domains note that recovery metrics—minutes played, days rested, practice intensity—underpin universality, with 70% of peaks following optimal downtime. Here's where it gets interesting: combining markers across sports sharpens accumulators, as seen in 2025-26 parlays linking Haaland's form to O'Brien runners and Alcaraz clay tilts.
One study revealed that 82% of cross-verified cycles hit, from Villa's Watkins surging alongside Guineas trials horses and Rome-bound clay pros; experts deploy rolling averages over 5-10 events, flagging momentum when metrics exceed seasonal norms by 15%. And while variables like injuries interrupt, baseline rebounds occur 80% of the time post-dips, making these markers resilient tools for those dissecting April 2026's packed calendars.
Conclusion
Momentum markers illuminate form cycles in Premier League forwards, flat racers, and clay court specialists, transforming scattered stats into predictive frameworks that repeat season after season; data consistently shows streaks in goals, speed figures, and wins driving outsized performances, particularly amid spring schedules like those in April 2026. Those attuned to these signals—rolling averages, rest patterns, secondary metrics—uncover edges where cycles align, bridging football pitches, turf tracks, and clay courts into cohesive insights. The reality is, tracking persists as a cornerstone for informed decisions, with historical and current data affirming their reliability across these high-stakes arenas.