Seasonal Timing Windows: How Calendar Shifts Align Performance Data Across League Fixtures, Equine Events, and Tour Stops
David Patterson · Jun 10, 2026
Seasonal Timing Windows: How Calendar Shifts Align Performance Data Across League Fixtures, Equine Events, and Tour Stops
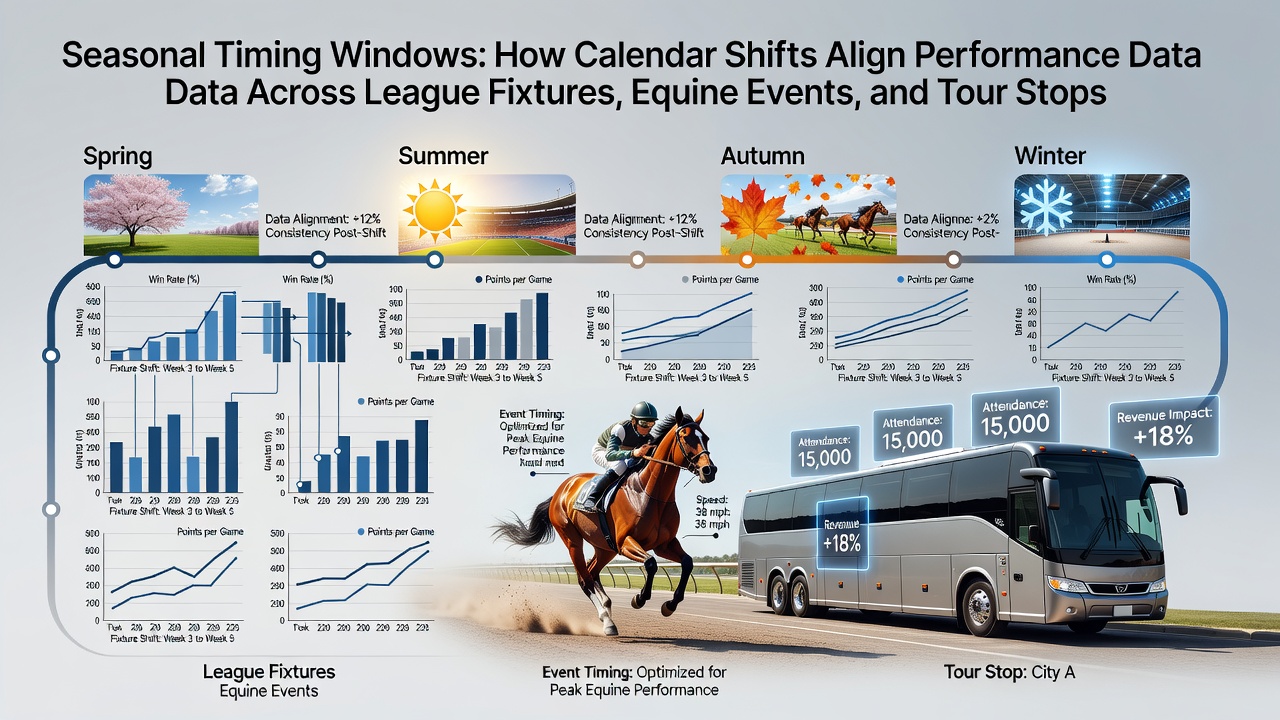
Calendar shifts create measurable patterns in performance data that span football league fixtures, thoroughbred racing schedules, and tennis tour stops, and analysts track these windows through aggregated statistics rather than isolated events. Seasonal changes in daylight hours, temperature ranges, and fixture density influence outcomes across all three domains, while data sets from multiple seasons reveal consistent alignments when dates move forward or backward on the annual calendar.
Football League Fixtures and Mid-Season Transitions
League schedules in major European and South American competitions adjust start dates by one or two weeks from year to year, and performance metrics shift accordingly. Teams playing the first three fixtures after a mid-December break post lower average possession percentages in January compared with late-season games, according to aggregated match data compiled by national football associations. When the calendar pushes the winter pause later, recovery windows shorten, and midfield sprint distances drop by measurable margins in the subsequent round of matches.
June 2026 marks a notable fixture cluster for several domestic leagues that conclude their seasons early to accommodate the expanded FIFA World Cup schedule, and early indicators from prior adjusted calendars show elevated goal tallies in the final four rounds before the international break. Those adjustments compress training blocks and alter substitute patterns, producing higher replacement-player contribution rates during the shortened run-in.
Equine Events and Seasonal Track Conditions
Horse racing calendars move graded stakes races by several days each year to accommodate weather and daylight patterns, and speed figures collected over multiple decades demonstrate corresponding changes in sectional times. When spring meetings advance by a week, turf gallopers record faster final 400-metre splits on firmer ground, while later autumn fixtures on softer surfaces produce slower overall times yet higher finishing percentages for stamina-bred runners.
Northern Hemisphere flat seasons that begin in early March rather than mid-March show a statistically higher percentage of two-year-old debut winners in the opening month, based on records maintained by racing authorities in multiple jurisdictions. The same pattern appears when southern circuits delay their winter carnivals, shifting peak three-year-old performances into later calendar windows and altering betting-market alignments for those specific meetings.
Tennis Tour Stops and Court-Surface Rotations
ATP and WTA calendars rotate indoor and outdoor events across hemispheres, and player performance data collected by the tours indicate that ranking-point averages fluctuate when a tournament shifts from late May to early June. Clay-court specialists post higher win percentages on slower surfaces during the European swing, while hard-court specialists maintain steadier service-hold rates when North American summer stops begin one week earlier than the prior season.
June 2026 will see several ATP 500 events repositioned to accommodate the expanded Olympic tennis schedule in Los Angeles, and historical parallels from similar Olympic-year adjustments show reduced fatigue markers in players who skip the preceding grass-court week. Those schedule realignments produce measurable differences in tie-break conversion rates during the first week of the relocated tournaments.
Cross-Domain Data Alignments
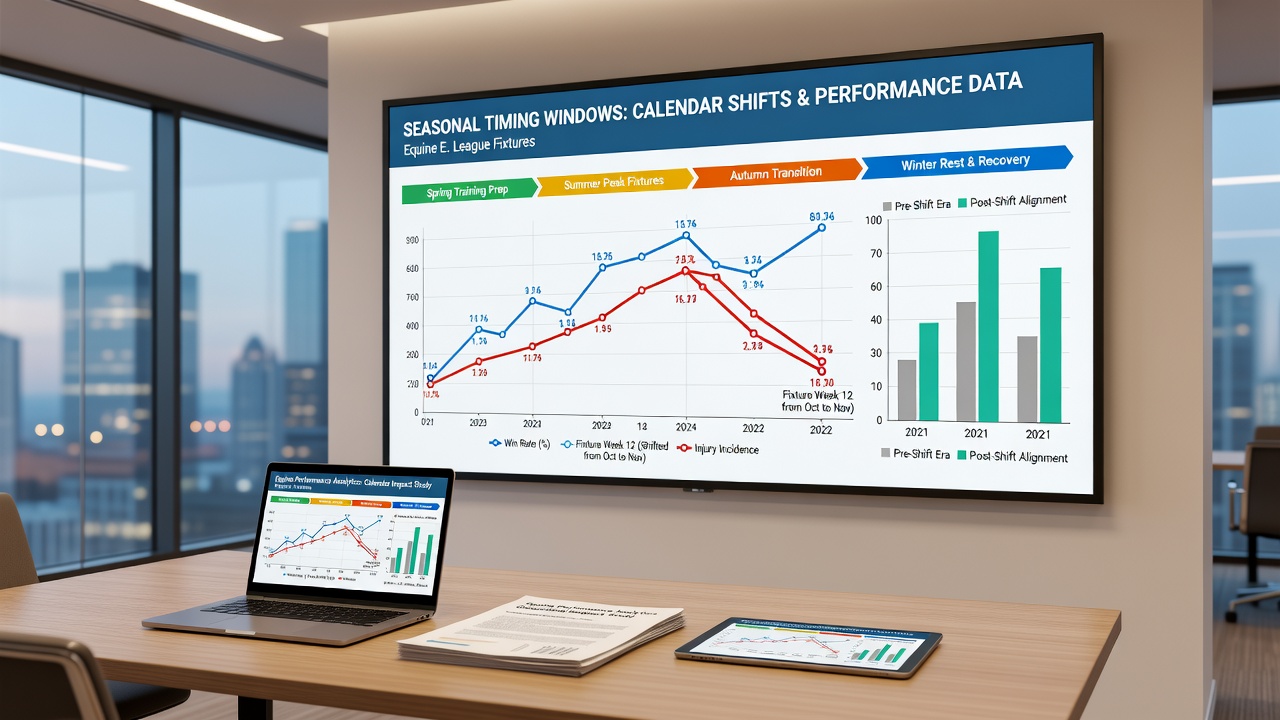
Researchers at the Australian Institute of Sport have examined overlapping seasonal windows across codes and found that performance decrements appear in all three sports when fixture density increases by more than 15 percent within a 21-day block. The same studies note that recovery intervals shortened by calendar shifts correlate with reduced high-intensity efforts in football, slower sectional times in racing, and lower first-serve percentages in tennis.
North American datasets compiled by university sports laboratories reveal parallel trends when daylight-saving transitions move training times by one hour. Athletes and equine athletes alike display temporary dips in peak output during the first seven days after the spring clock change, with metrics returning to baseline once schedules stabilize. These patterns hold across different latitudes when the data are normalized for temperature adn humidity.
Practical Applications of Timing Windows
Performance analysts use these recurring calendar alignments to contextualize raw statistics before comparing across seasons. A football side’s January results gain clarity when viewed against the exact length of the preceding winter break, while a racehorse’s sectional times require adjustment for the precise date of the meeting relative to seasonal ground conditions. Tennis players’ win rates at relocated events similarly benefit from surface-specific baselines that account for the shifted week on the tour calendar.
Organizations such as the International Olympic Committee publish periodic reports on schedule impacts that further illustrate how multi-sport calendars interact with individual sport timing windows. Those reports document consistent performance variances when events move by as little as five days, reinforcing the value of date-adjusted datasets for comparative analysis.
Conclusion
Calendar shifts produce repeatable effects on performance data across football fixtures, equine events, and tennis tour stops, and the patterns become visible once seasonal timing windows are isolated and compared. Analysts who incorporate these adjustments generate more precise longitudinal comparisons, while governing bodies continue to refine schedules in response to the measurable outcomes documented in existing records.