When Fixture Fatigue Meets Form Curves: Mapping Congestion Ripples Through Soccer Rotations, Tennis Back-to-Backs, and Racing Layoff Windows
Hugo Reed · Aug 5, 2026
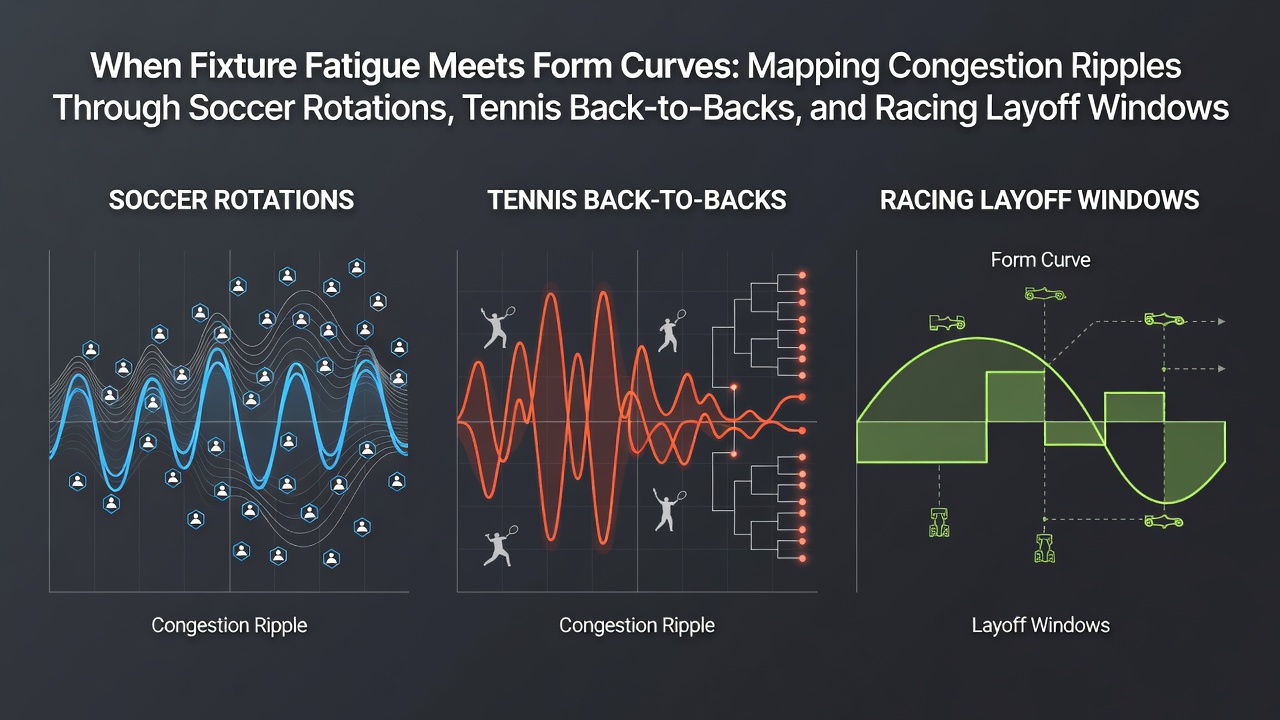
When Fixture Fatigue Meets Form Curves: Mapping Congestion Ripples Through Soccer Rotations, Tennis Back-to-Backs, and Racing Layoff Windows
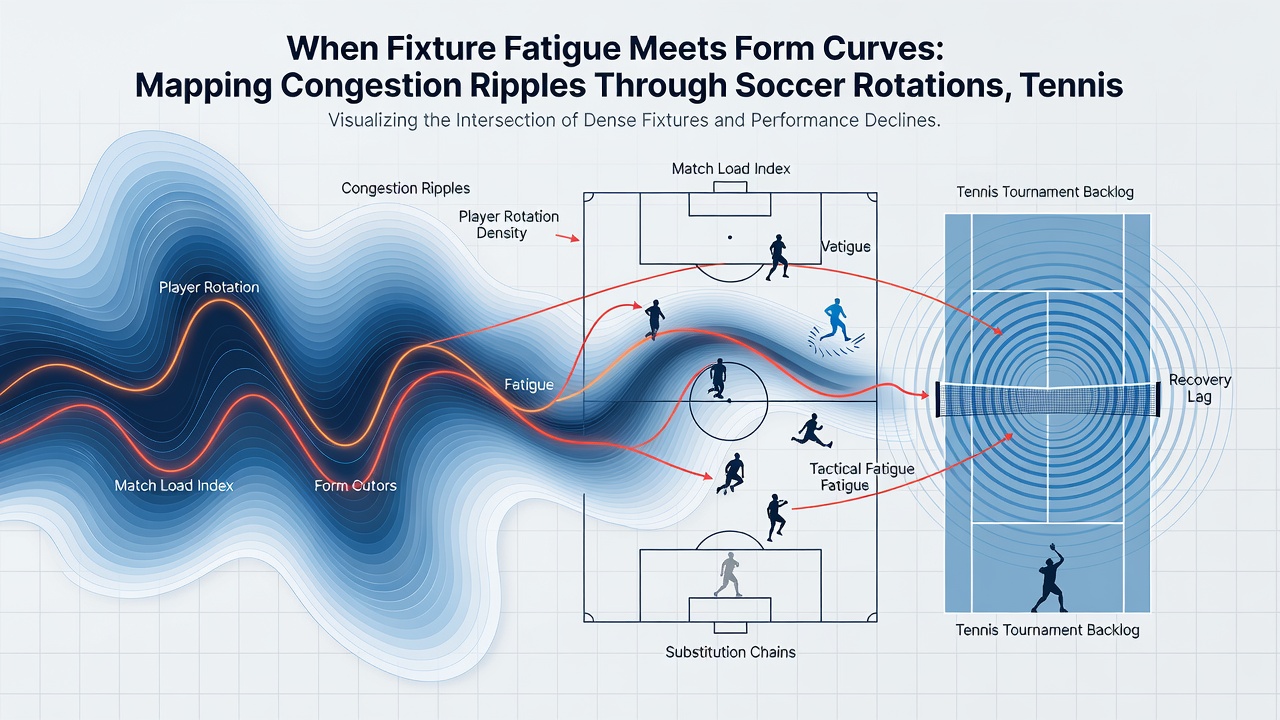
August 2026 brings a cluster of overlapping schedules that push soccer squads, tennis players, and thoroughbreds into tight windows where recovery intervals shrink and performance curves shift in measurable ways. Data from league fixtures, tournament draws, and racing calendars show how consecutive demands alter output, with teams and trainers responding through rotation patterns, rest allocations, and targeted training adjustments. Observers note that these periods produce ripples across form indicators rather than uniform declines, and tracking those patterns requires separating load effects from other variables such as travel and opponent strength.
Soccer Rotations Under August Congestion
Premier League and European league calendars place multiple domestic and continental matches within short spans, prompting managers to cycle players through starting lineups to maintain squad availability. Figures from the 2025-2026 season carry forward into 2026 and indicate that sides averaging more than one match every four days register drops in high-intensity running distance after the third consecutive fixture, while pass completion rates hold steadier when midfield rotations occur at regular intervals. Analysts examine substitution timings and minutes-per-player logs to map how early changes correlate with sustained defensive organization later in congested blocks. Those patterns become visible in both top-half and mid-table clubs because the underlying recovery demands remain consistent regardless of league position.
Tennis Back-to-Back Scheduling and Surface Transitions
Professional tennis circuits schedule events in close succession during the North American hard-court swing that peaks in August, requiring players to move from one tournament to the next with limited rest days. Match data compiled across ATP and WTA events reveal that win percentages in second matches within 48 hours decline by measurable margins when prior match duration exceeds two and a half hours, yet players who adjust serve percentages upward in those follow-up encounters maintain higher hold rates. Tournament directors publish draw timelines that allow observers to calculate exact turnaround windows, and performance analysts cross-reference those intervals against rally length statistics to identify where fatigue first appears in extended baseline exchanges. Surface consistency within the hard-court block reduces some variables, but cumulative court time still registers in movement efficiency metrics tracked by Hawk-Eye systems.
Racing Layoff Windows and Return Performance
Thoroughbred racing calendars incorporate planned layoffs between campaigns, and August entries often mark returns from breaks of 30 to 90 days depending on the horse's prior campaign length. Records maintained by racing authorities demonstrate that first-up runners with layoffs in that range post competitive speed figures when their most recent workouts include targeted gallops at race distances, whereas shorter layoffs under three weeks show higher rates of early fade in longer events. Trainers file official work reports that allow handicappers to compare sectional times against historical benchmarks for each horse, creating datasets that separate genuine freshness from residual effects of previous campaigns. These return metrics interact with track conditions and distance changes, producing form curves that shift more noticeably in sprint races than in staying events.
Connecting the Ripples Across Disciplines
Performance databases now aggregate workload markers from soccer GPS units, tennis court-time logs, and equine heart-rate monitors, permitting cross-sport comparisons of how repeated high-load days alter output curves. Research published in the European Journal of Sport Science examines overlapping principles of load management and finds that both human athletes and racehorses exhibit similar patterns of reduced peak velocity after three or more dense performance days when recovery protocols remain constant. Industry reports from the Australian Sports Commission further detail how scheduled downtime windows influence subsequent metrics, providing reference points that analysts apply when modeling soccer squad rotations against tennis recovery intervals. Those combined datasets highlight that the timing of interventions, rather than total volume alone, determines how quickly form indicators rebound after congestion peaks.
August 2026 schedules illustrate these interactions clearly because multiple competitions converge within the same calendar month, forcing decision-makers in each sport to balance immediate selection needs against longer availability targets. Tracking tools that convert raw workload data into projected performance bands allow for more precise mapping of where congestion ripples appear first and how long they persist before baseline form resumes.
Conclusion
Fixture density, tournament sequencing, and layoff timing create measurable shifts in performance indicators across soccer, tennis, and racing. Observers who compile rotation logs, match-interval statistics, and return-to-competition figures can trace the progression of those shifts through the month of August 2026 and beyond. The resulting maps show that recovery allocation and selection adjustments function as primary levers for moderating congestion effects, with data sets from sports science bodies and racing authorities supplying the benchmarks needed to quantify those adjustments over successive cycles.